HOW IT WORKS
Every change in your stack, mapped to the customers it touches
Connect the tools your team already uses. opSentry watches every change, figures out which partners it puts at risk, and hands you the alert — and the action — before it becomes a support fire. Each integration below is mapped exactly the way it runs, with the moment it saves you marked along the way.
THE PROBLEM — AND THE FLOW
The gap between shipping a change and finding out it hurt a partner
Most teams find out a change broke something the same way: an angry support ticket — by which point it's already a churn risk. Breaking changes drive a big share of technical churn, and the customer blames your product no matter whose API actually failed. opSentry closes that gap. It sits at the center of your tools, connects an engineering change to the partners who depend on you, and gives you the early warning before the ticket ever arrives.
A change ships and you learn it hurt a partner from a support ticket — when it’s already a churn risk and your team is in firefight mode.
opSentry catches the impact the moment it ships and names the partners at risk, so you reach out proactively — before they’re ever hit.
- One hub, every signal — engineering, support, partner map, and tests in a single view.
- The agent connects dots across separate tools that a human would miss.
- You move from reactive firefighting to a proactive heads-up — the cheapest trust win there is.

THE DASHBOARD
Your dashboard, your way
The dashboard is your command center — and it's yours to arrange. Every section is a module you can drag to reorder, or toggle on and off. Two modules do the heavy lifting: the Intelligence Banner at the very top, and the Live Signals feed below it.
- Drag to reorder modules and toggle the ones you don’t need — your layout, saved per workspace.
- Active alerts by severity, currently-impacted partners, analytics, tickets, tests — at a glance.
- The dashboard reflects your Settings: connect a tool and its module comes alive automatically.
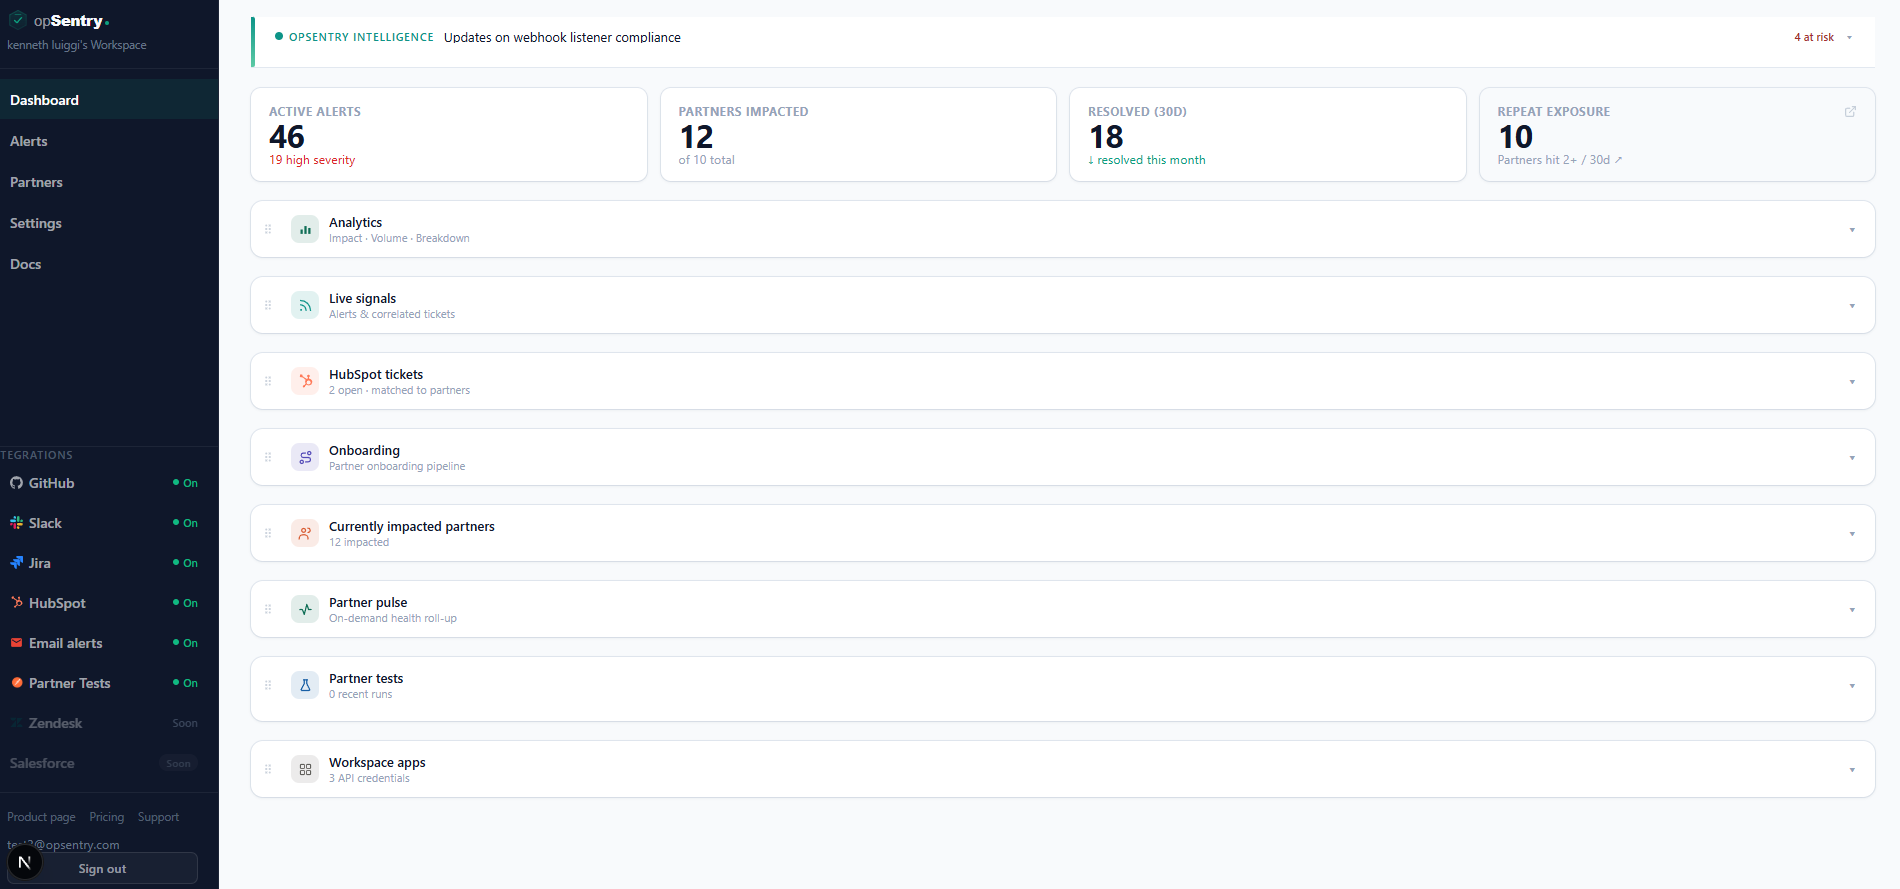
Your command center — drag-to-reorder modules, with every integration’s status in the sidebar.
LIVE SIGNALS
Every signal, every source, in one feed
Live Signals is the unified, real-time feed of every way risk can reach you — each one tagged by how it arrived. GitHub releases, Jira issues, HubSpot tickets, changes posted through the API, and the agent's own correlated escalations all land in one place, newest first.
- See every arrival channel in one place — nothing hides in a separate tool.
- A correlated escalation stacks a change + ticket + failing test into a single signal.
- Pin the signals you’re actively tracking; filter the whole feed by partner.
- Each row shows severity, source, partners and timing — click to open the full alert.
Signals arrive in five different tools, so the connection between a change and the ticket it caused gets lost.
Every signal lands in one feed, tagged by source — and related ones are stacked into a single correlated escalation.
A working mock-up — try the search and partner filter.
ANALYTICS
Are we getting better at this?
Analytics turns your alert history into the numbers leadership asks for — mean time to resolve, resolution rate, high-severity rate, and volume trend — plus a partner-health view that ranks who carries the most unresolved risk.
- Mean-time-to-resolve and resolution rate show whether your process is actually improving.
- High-severity rate and volume trend flag when risk is spiking.
- Partner-health bars rank who carries the most unresolved risk, by severity.
- Switch the window between this week, 30 days, and quarter.
PARTNER HEALTH
Which partners are at risk — now, and trending
Two views answer the partner question. Currently impacted partners shows exactly who an active change is hitting right now; Partner Pulse is an on-demand AI health roll-up that sorts every partner into a tier and can post a digest to Slack.
- Currently-impacted partners: exactly who an active change is hitting, right now.
- Partner Pulse sorts every partner into Stable, At-risk, or Escalating — with an AI key signal.
- Post the pulse digest to Slack so the whole team sees partner health at once.
- Click any partner to drill into their full signal history.
Partner health lives in someone’s head or a stale spreadsheet, so at-risk accounts get noticed too late.
Every partner is scored and ranked automatically — at-risk accounts surface before they churn.
INTEGRATIONS
Connect what you already use
Every integration is a one-time login or key — no code, no infrastructure. Each one runs its own flow; click any below for its process map, drawn exactly the way it works in production, with the moment it saves you marked in amber and teal.
GITHUB
Every push and release, checked for partner impact
Point a signed webhook at opSentry and every push and published release is checked automatically. The agent reads each one, decides whether it could affect a partner, and only then raises an alert — with a severity, a plain-English summary, and a suggested action.
A breaking change ships — and the partner finds out first, through a support ticket that’s already a churn risk.
opSentry catches it the moment it ships and names the exact partners at risk, before they’re ever hit.
- Signed (HMAC) and de-duplicated, so re-deliveries never double-alert.
- Changes with no partner impact are filtered out — you only see what matters.
- AI mode for full briefs, or a rule-based simple mode — your choice in Settings.
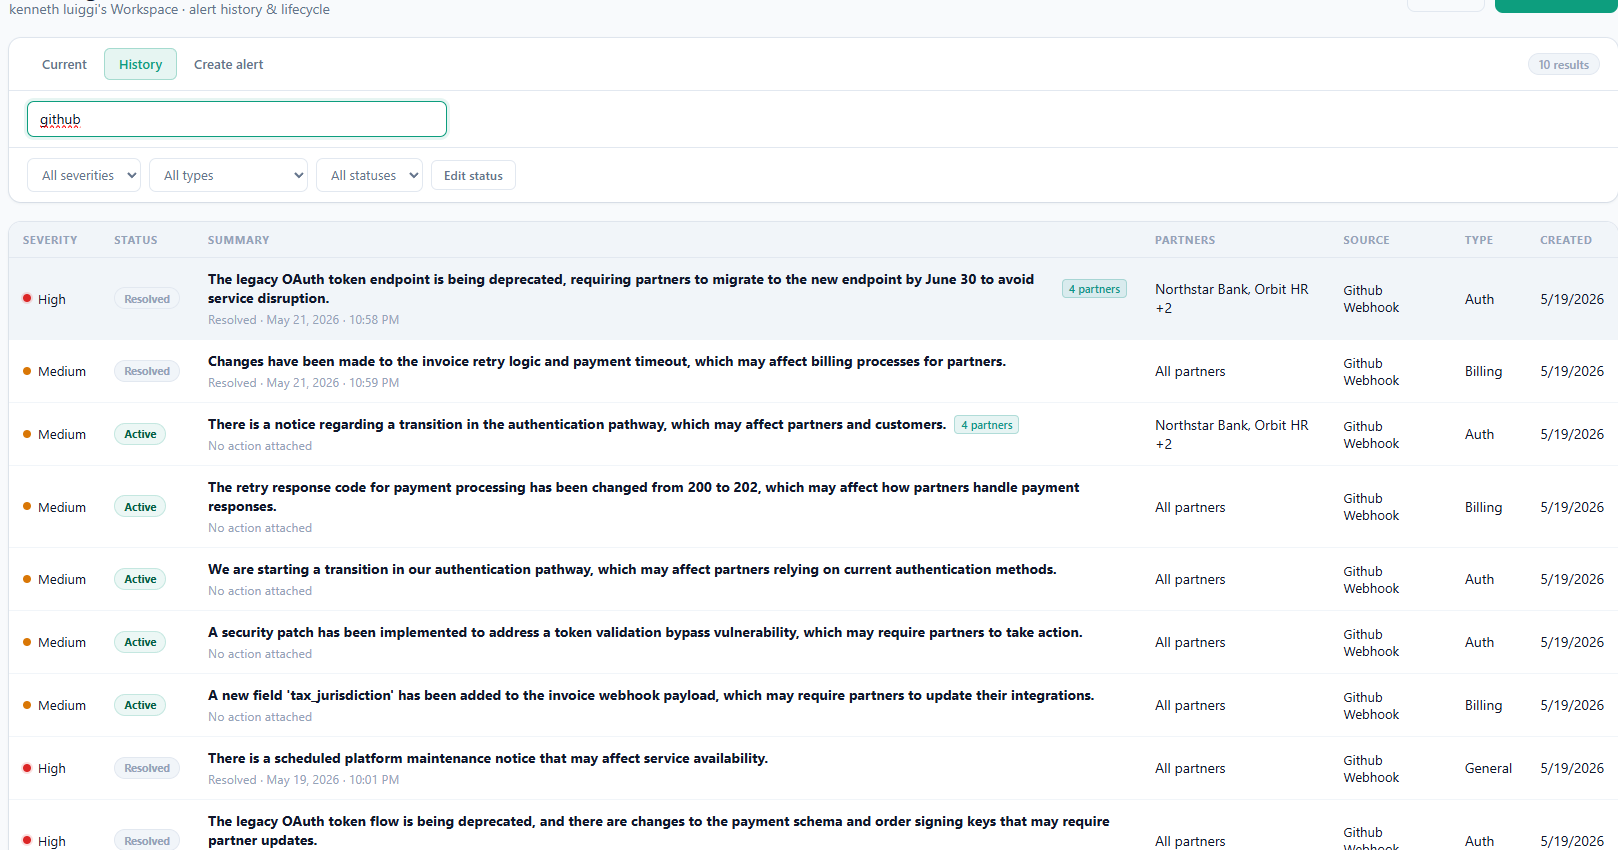
Every GitHub push and release becomes an alert — searchable, severity-tagged, with the partners it impacts.
JIRA
Issues, sprints and releases that keep your alerts honest
Connect Jira by signed webhook or one-click OAuth (which registers the webhook for you). opSentry turns issues, sprint changes, and version releases into alerts, and spots risk patterns like repeat-failure components and reopened regressions — even auto-resolving an alert when the issue closes.
A release or reopened bug slips out; the regression only surfaces weeks later as a partner escalation.
The agent scores impact and flags repeat-failure zones and regressions the moment the issue lands.
- OAuth path auto-registers and renews the webhook — nothing to maintain.
- Pattern detection flags hot zones and regressions a single ticket wouldn’t reveal.
- Alerts stay in sync with the issue and auto-resolve when it’s done.
HUBSPOT
Know which tickets are really partner escalations
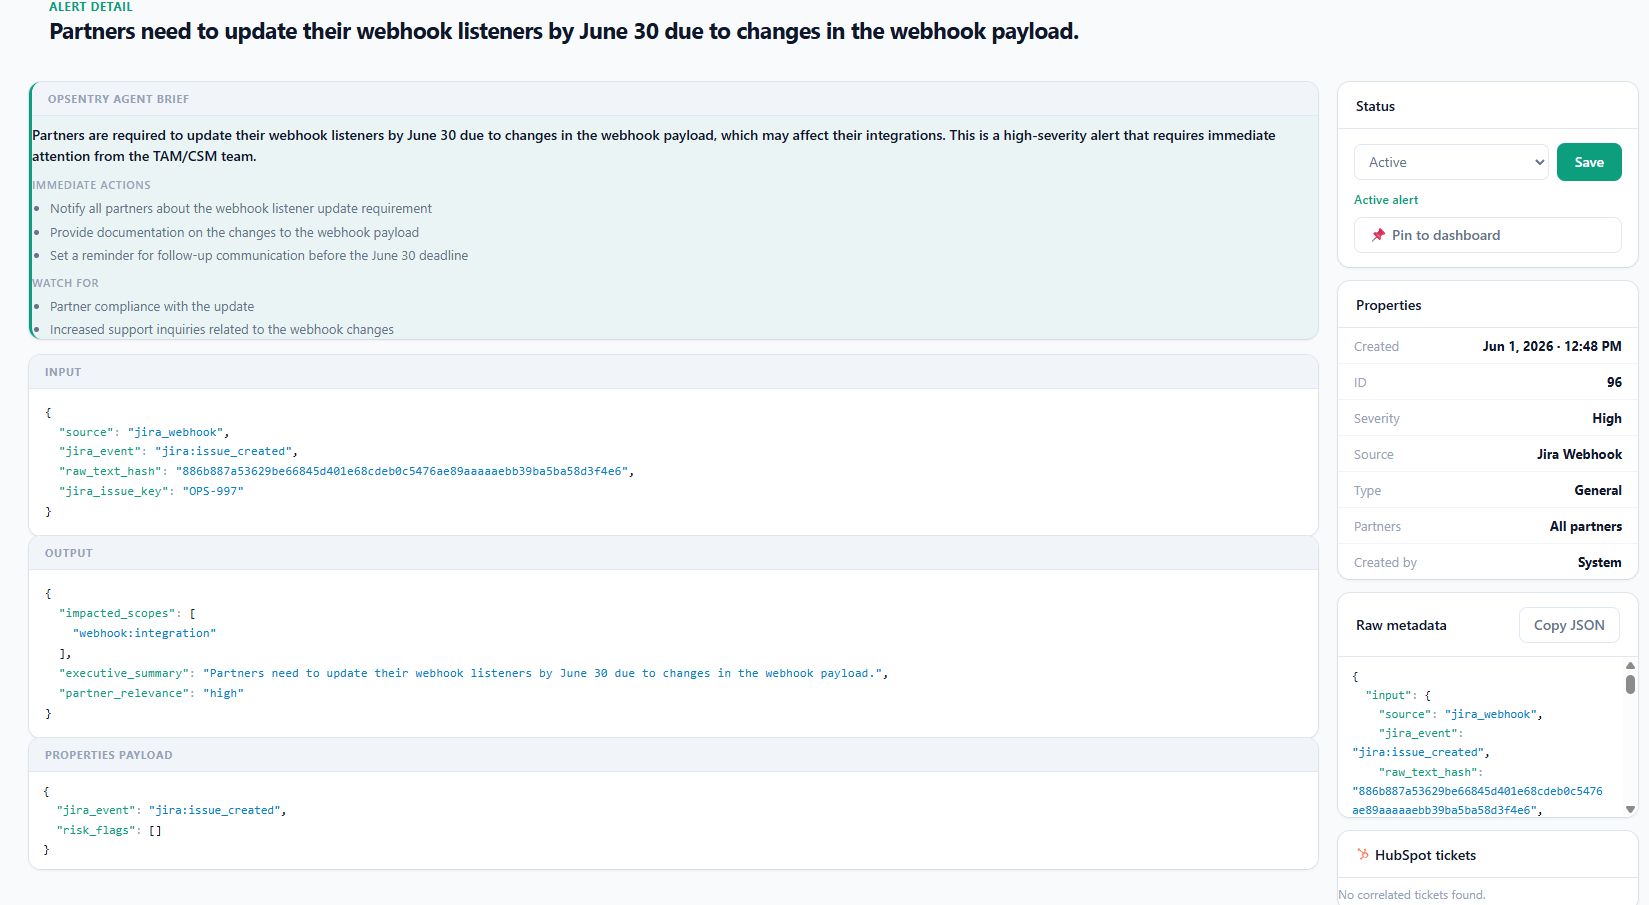
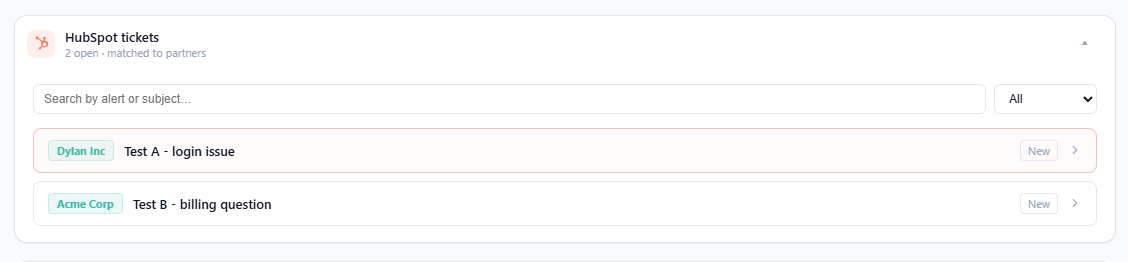
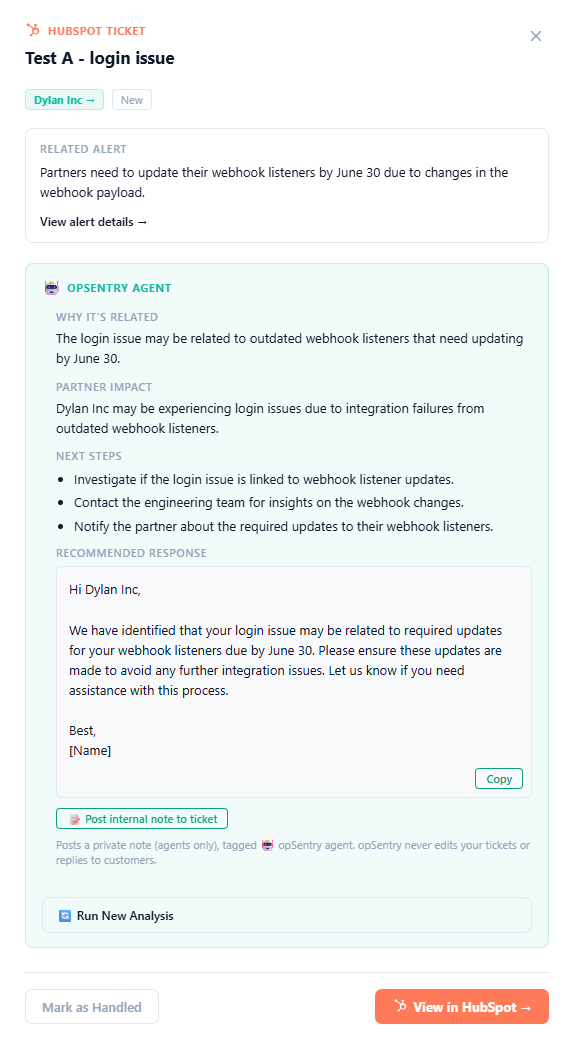
Connect HubSpot and opSentry matches each open ticket to the right partner, then links it to the change that likely caused it. Matching is precise: email domain first, then company name — never a guess from the ticket text. Correlation runs two passes: a fast partner-name match, then AI when a deeper read is needed.
A ticket looks routine in the queue — but it’s really a partner escalation tied to a change no one connected.
opSentry matches it to the partner and the change behind it, and explains why, the impact, and how to reply.
- Matched to the partner by email domain first, then company name — not by scanning the body.
- Linked to the change behind it: a fast partner match, then AI semantic correlation when needed.
- AI insight explains why it’s related, the partner impact, and a ready-to-send reply.
- Tokens auto-refresh; a dismissed ticket re-surfaces if it re-escalates.
CHANGELOG API
Push changes in from your own systems
Prefer to send changes yourself? Create API credentials and POST a changelog from your own systems or CI pipeline. opSentry authenticates the caller, then runs the same AI translation, partner-matching, and alerting the other integrations use — no dashboard required.
Changes ship through CI faster than any human can assess which partners they put at risk.
Every shipped change is impact-scored and partner-matched automatically — right in your pipeline.
- Client-ID + secret auth, encrypted at rest — built for machine-to-machine use.
- Same impact scoring, partner matching, and brief as every other source.
- Drop it into any release pipeline to catch impact at ship time.
SLACK
Get pinged the moment risk appears
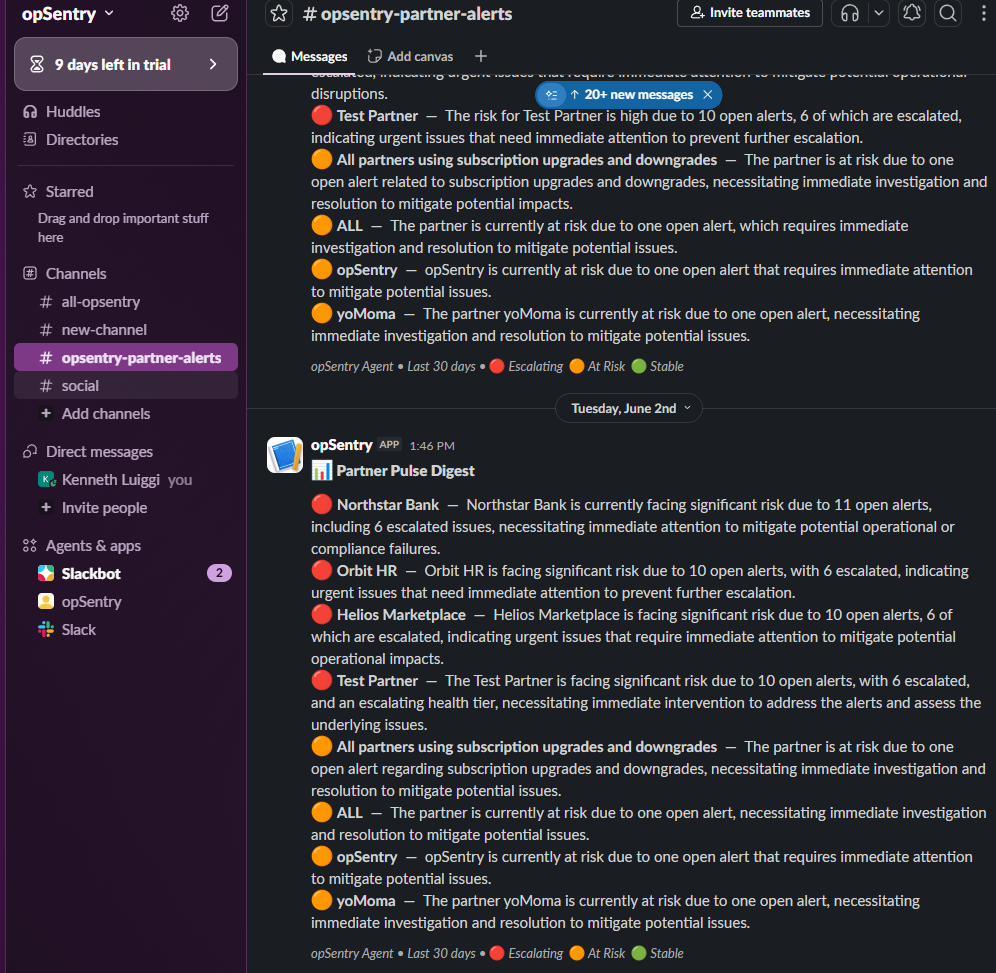
Add a Slack connection (OAuth or a webhook URL) and opSentry pushes every new alert, escalation, and partner-pulse digest straight to your channel. You shouldn't have to babysit a dashboard — the risk comes to you.
A warning sits unseen in a dashboard nobody’s watching until the partner is already on the phone.
It’s pushed to the channel your team already lives in the instant it appears.
- Alerts land in the channel your team already watches.
- Cross-signal escalations ping you the moment signals stack into something bigger.
- Fire-and-forget: a Slack hiccup never blocks an alert from being created.
Alerts and digests, no login required
Add email subscribers and opSentry sends the same alerts and ticket-update digests by email, each with a deep link straight to the alert. Perfect for stakeholders who don't live in the dashboard.
The stakeholders who most need the heads-up — execs, partner managers — don’t live in the dashboard.
They get the alert in their inbox, with a deep link straight to it. No login required.
- Per-workspace subscriber list — add or remove anyone in Settings.
- Every email deep-links to the exact alert it’s about.
- Covers new alerts and HubSpot ticket updates alike.
PARTNER TESTS
Run API tests against a partner — right from the alert
Connect Postman and, from any alert that has partners, run your collection against the partner's live API without leaving opSentry. A breaking change shows up as a failing test before the partner ever notices — so you confirm impact, not just suspect it.
You suspect a change broke a partner’s integration — but can’t prove it until they complain.
Run the partner’s own tests on demand; a failing request confirms the break before they notice.
- Triggered from inside an alert and scoped to its partners — no tab-switching.
- Results land back on the alert with each failing request flagged.
- opSentry auto-correlates failures that reference the affected partner.
A live mock-up of the real console — click the tabs to explore, and hit Run to see a failing request confirm the break.
WRITE-BACK
opSentry writes back — where your team already works
Insight is more useful inside the ticket than in another tab. With one click, opSentry posts a private, agents-only internal note on the HubSpot ticket — tagged 🤖 opSentry — so the context lives right where your support team is already working.
Support works the ticket blind to the change behind it, so the customer re-explains and the fix drags on.
The full context is posted as a private note right on the ticket — where support already works.
- One click posts the full context as an internal note on the ticket.
- Always private and agents-only, clearly tagged — ownership is verified first.
- Never edits tickets, never replies to customers — your team stays in control.
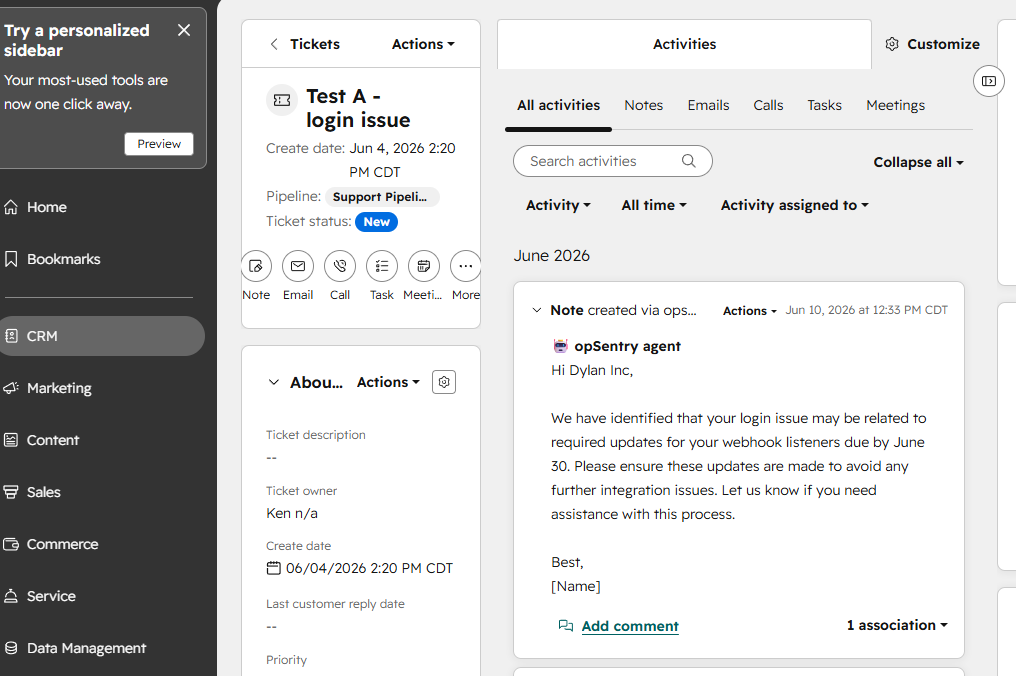
The note lands in HubSpot’s activity feed, created by 🤖 opSentry agent — visible to your team, never the customer.
PARTNER MAPPING
The map everything keys off
The partner map is what makes the rest work. Define your partners and what each one depends on — the scopes, areas, and products they rely on, plus their email domain for ticket matching — and opSentry matches every change and every ticketagainst it to decide who's actually affected.
- Define partners once; every alert and ticket is matched automatically.
- Impact is specific — “these three partners,” not “something changed.”
- Upload via CSV/JSON or add rows by hand — it stays your source of truth.

ALERTS
From signal to resolved
An alert is the unit of work in opSentry. Each one carries a severity, the partners it hits, and an agent brief — what happened, what to do now, and what to watch for. When signals stack — a change, a ticket, and a failing test all pointing at the same partner — the agent escalates them into one correlated alert so you see the full blast radius, not three disconnected dots.
- Severity at a glance — High, Medium, Low — so the urgent stuff is unmissable.
- A plain-English agent brief: what changed, the immediate action, and what to watch for.
- Cross-signal escalation merges related signals into one alert with the real impact.
- Run a partner test or post an internal note straight from the alert; flip it Active ↔ Resolved when handled.
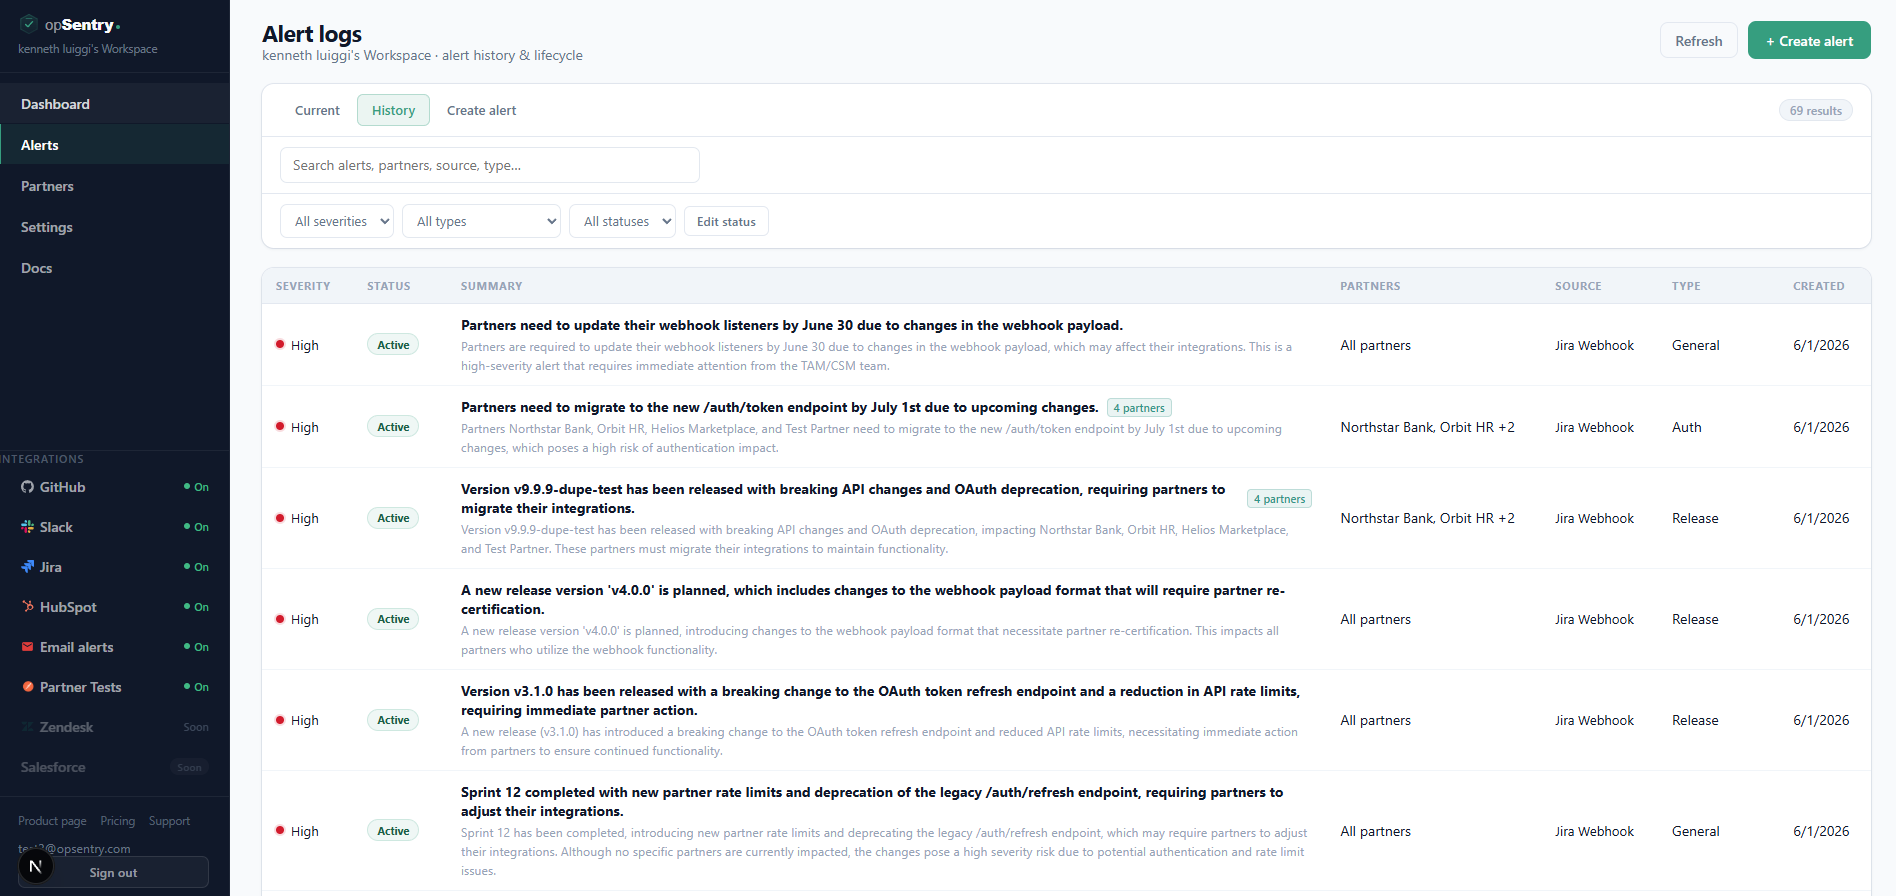
The alert log — every change as an alert with severity, status, source, type, and the partners it hits. Search and filter the whole history.
CROSS-SIGNAL ESCALATION
When signals stack, opSentry connects them
This is the part a human misses. When a code change, a support ticket, and a failing test all point at the same partner, the agent merges them into one escalated alert, bumps the severity, and pings Slack — so you see the full blast radius instead of three disconnected dots.
- The agent correlates signals by partner across engineering, support, and tests.
- Severity is bumped automatically when signals stack — the worst rises to the top.
- A single escalated alert replaces three disconnected ones.
- An instant Slack escalation notice so nobody misses the pattern.
Three teams each see one harmless-looking signal; nobody connects them until the partner escalates.
opSentry connects them by partner into one high-severity alert — the early warning a human would miss.
SETTINGS
One place to control it all
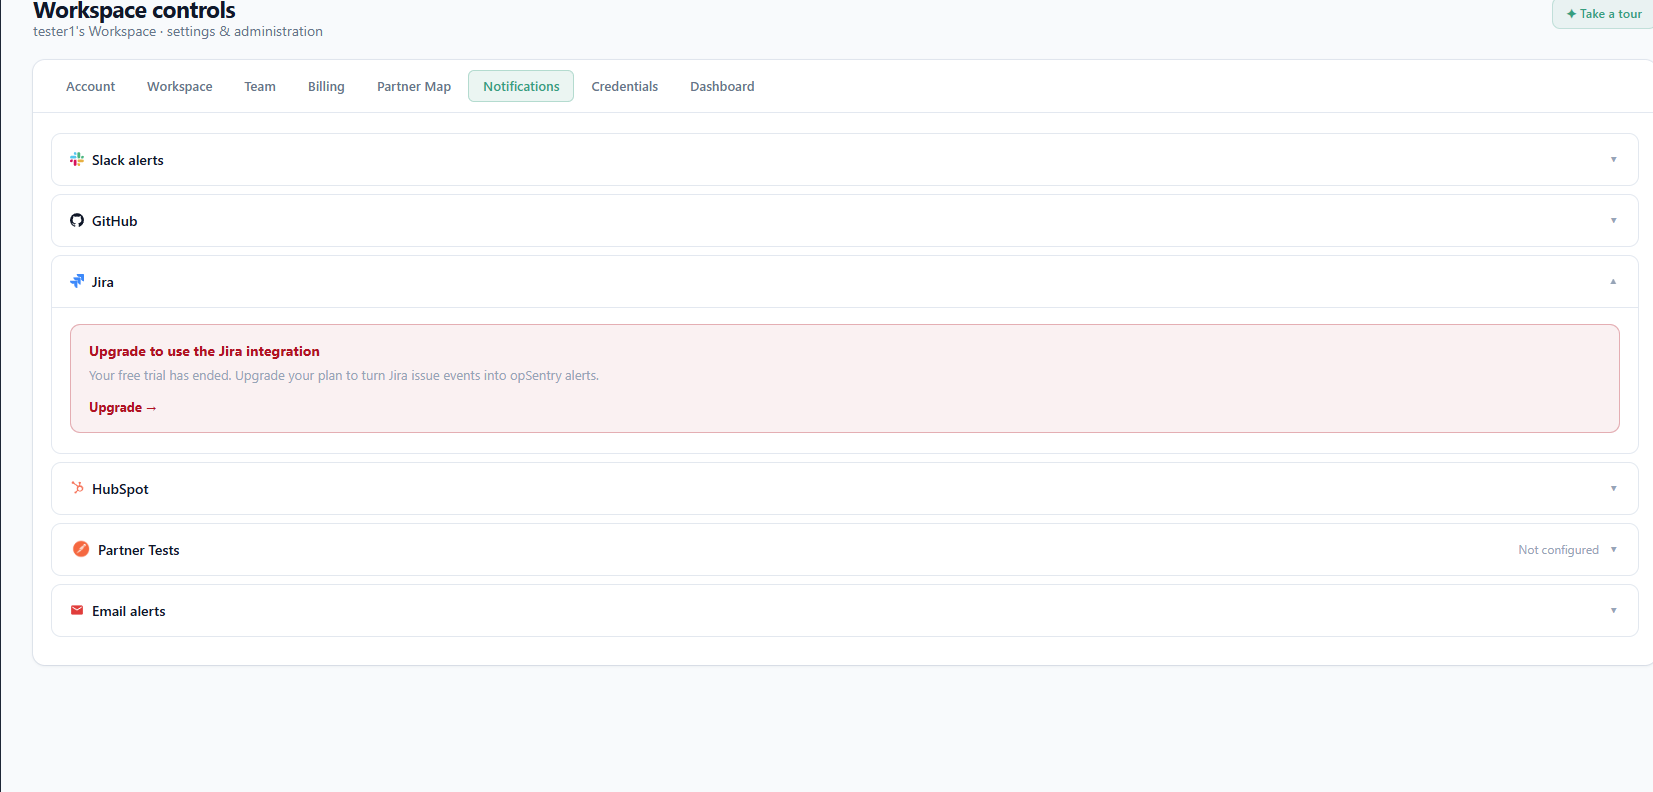
Everything above is configured in Settings — and connecting a tool is just a one-time login or key. Manage your integrations, notification subscribers, team and roles, and dashboard layout from a single place. Connect = on-demand; add the optional webhook = real-time.
- Connect, disconnect, and configure every integration in one panel.
- Manage Slack/email notification subscribers and invite your team with roles.
- No engineering work — connecting is a login, not a setup project.
TEAM & PLANS
Built for a team, priced to start free
Invite your team with Owner, Admin, and Member roles — admins control integrations, billing, and notifications; everyone shares one source of truth. Start free and upgrade when you need more AI and integrations, with usage always visible.
- Role-based access — admins manage setup, members stay focused on the signal.
- Invite teammates by email; everyone works from the same workspace.
- Start free; upgrade for more AI analysis and integrations as you grow.
- AI usage and plan limits are always visible in Settings — no surprises.